In 2017 and 2018, the World Machine Tool Survey from Gardner Intelligence, the research arm of Modern Machine Shop publisher Gardner Business Media, showed that 12 out of the top 15 machine tool consuming countries increased their consumption. It is relatively rare for this to happen in a single year, and this was the only time it had ever happened in back-to-back years. This worldwide upturn and the extremely cyclical nature of the machine tool market should have been a clue to the fate of machine tool consumption in 2019, which was a worldwide downturn.
According to the latest survey, the results of which have recently been published, global machine tool consumption decreased by $13.1 billion, or 13.8%, to $82.1 billion in 2019. Therefore, 2019 had the lowest level of machine tool consumption since 2010, when much of the global economy was just starting to recover from the Great Recession. And, in an about face of 2018, 12 out of the top 15 consuming countries decreased their machine tool consumption in 2019.
Featured Content


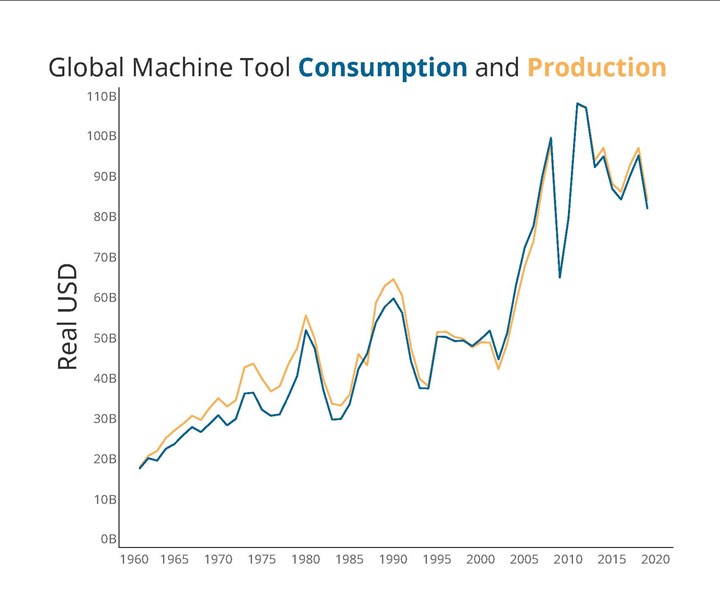
According to the 2019 World Machine Tool Survey, global machine tool consumption decreased to the lowest level since 2010, when much of the global economy was just starting to recover from the Great Recession. Global machine tool production followed a similar pattern, falling to its lowest level since 2010.
China Leads the Contraction
While there was a recovery in 2017 and 2018, the global machine tool market has essentially contracted since 2011. Much of this contraction is due to China, which most certainly led the contraction in 2019. China’s 2019 consumption was $22.3 billion, falling $6.4 billion, or 25.3%. The decrease in China’s machine tool consumption accounted for nearly half of the global decline.
The Chinese automotive industry, among others, slowed toward the end of 2019. The Chinese economy was also hit particularly hard by the quarantines to contain COVID-19. As a result, China’s machine tool consumption will likely see another significant decline in 2020, perhaps another 15-25%, or roughly $5 billion.
China’s machine tool consumption accounted for 27.2% of the market in 2019. This was the first time China’s machine tool consumption accounted for less than 30% of the global market since 2008. And the country’s share of the global market could fall again in 2020 as work moves toward Southeast Asian countries not hit as hard by COVID-19 and Mexico, which continues to claim a larger presence in global manufacturing.
Mexican Manufacturing Grows
Mexico consumed $2.5 billion in machine tools in 2019. That was its third highest total ever and its eighth consecutive year with more than $2 billion in consumption. Mexico consumed 9.1% more machine tools in 2019 than it did in 2018. Of the top 15 consumers, Mexico had the second largest increase (only Brazil increased more). Mexico’s 2019 growth was also the fifth fastest in the world. Three of the faster-growing countries were significantly smaller consumers, making their higher rates of growth much easier to achieve.
Mexico maintained its ranking as the eighth-largest machine tool consumer in the world in 2019. However, the country significantly increased its share of global machine tool consumption to 3.1% from 2.4%. In 2019, Mexico consumed its largest share of the global machine tool market ever.
Effects of North American Reshoring
The U.S., the world’s second-largest consumer, bought $9.7 billion of machine tools in 2019, which was down just 1.6% from 2018. That made 2019 the U.S.’s third-highest year for machine tool consumption since 1998.
Of the 12 countries that decreased consumption in the top 15 consumers, the U.S. recorded the smallest decline. As a result, the U.S. significantly increased its share of the global machine tool market. In 2019, the U.S. consumed 11.9% of the world’s machine tools. This was the U.S.’s highest share of global consumption since 2001. This is significant because 2001 was the start of significant offshoring of U.S. manufacturing due to artificially low interest rates set by the Federal Reserve to help the country recover from the bursting of the dot-com bubble.
Since the end of the Great Recession in late 2009 or early 2010, the pendulum has swung back as manufacturing returns to North America, more specifically the U.S. and Mexico. The generally rising share of global machine tool consumption for both countries during that time is evidence of the reshoring or near-shoring trend.
COVID-19 has led several countries to lock down significant portions of their populations, which has led to a significant reduction in economic activity. It is quite possible that global machine tool consumption declines by 15% or more in 2020. If global machine tool consumption declines by 15%, it would drop below $70 billion for the first time since 2009, in the midst of the Great Recession.
Machine Tool Production Also Decreases
Global machine tool production has followed a similar pattern to consumption. In 2019, global machine tool production was $84.2 billion, which was a decrease of $12.9 billion, or 13.3%. Like global consumption, global production in 2019 fell to its lowest level since 2010. Only three of the 15 producers increased production in 2019: Brazil, France and Canada.
China, the world’s largest producer of machine tools, decreased its production by $4.6 billion, or 23.1%. China’s machine tool production has decreased six of the last eight years, falling to its lowest level since 2009. In 2019, China’s share of global production was 23.1%, which was its lowest share since 2008, when it was 16.4%.
Brazil was the lone country in the top 10 producers that increased its machine tool production. The country increased its production by 12.6% to $1.6 billion. Every one of the other top 10 producers cut their production. Germany and the U.S. were the only two that decreased their production less than 10%. As a result, both Germany and the U.S. increased their share of global machine tool production. Other countries in the top 15 producers to increase their global share of production include Italy, Austria, France, U.K. and Canada. Results of the survey show a small but noticeable shift in machine tool production to Europe from Asia.
The World Machine Tool Survey contains much more information, including not only consumption and production data, but also data related to imports and exports of the top 60 machine consuming countries. The report includes import and export data on high-level machine types. To purchase the report and the data supporting it, visit gardnerintelligence.com.
About the Survey
This is the 53rd edition of an independent annual survey that collects statistics from machine tool consuming and producing countries and compares them in real U.S. dollars. It is conducted through the research department of Gardner Business Media Inc. (Cincinnati, Ohio) by Steven Kline, chief data officer. Data for this report come from research conducted by Gardner Intelligence.
Traditionally, Gardner collected actual or estimated data on production, exports and imports from 26 countries. However, beginning with the 2015 survey, actual import and export data were included for every country that imported at least $100 million of machine tools in at least one year since 2001. This change added 34 more countries to the overall survey. For these additional countries, production was estimated, although in a few instances, actual production data were found on government websites.
Consumption is calculated by adding imports to and subtracting exports from production figures. The data typically are reported in local currencies, then converted to U.S. dollars. After this conversion, all data in this latest survey also were adjusted for inflation using the Bureau of Labor Statistics’ Producer Price Index for capital equipment. This adjustment promotes a more accurate historical comparison.
Sources of Data
Special assistance came from the 15-member CECIMO consortium (Brussels, Belgium) and AMT – The Association For Manufacturing Technology (McLean, Virginia). Also, for countries that did not report, import and export data were gathered from the International Trade Centre.
Definitions
A machine tool is usually defined as a power-driven machine, not portable by hand and powered by an external source of energy. It is designed specifically for metalworking either by cutting, forming, physical-chemical processing or a combination of these techniques.
Machine tools traditionally are broken down into two categories: metalcutting and metal forming. Metalcutting machines typically cut away chips or swarf and include (but are not limited to) broaching machines, drilling machines, EDM units, lasers, gear-cutting machines, grinders, machining centers, milling machines, transfer machines and turning machines such as lathes. Metal-forming machines typically squeeze metal into shape and include (but are not limited to) bending machines, cold-heading machines, presses, shears, coil slitters and stamping machines.
Data presented in the World Machine Tool Survey are solicited for metalcutting machines (codes 8456-8461 under the Harmonized Tariff System) and for metal-forming machines (8462-8463), and are solicited for complete machines only, not including parts or rebuilt machines.
Exchange Rates
All data reported in domestic currencies are translated into U.S. dollars using the average daily exchange rate for the year (not the end-of-year rate) as reported at Moody’s Analytics. All analysis is done in real U.S. dollars.
Shipments Versus Orders
In addition to contributing statistics to this survey, many countries also track orders for new machine tools. These are, by their nature, different sets of numbers, and they may or may not be related. This survey is based on actual shipments of new machine tools from the factories in which they are produced. In contrast, the various order compilations in individual countries around the world are based on bookings for machines that will be shipped in the future. The time lag between these two events can vary greatly. An in-stock lathe might be shipped one day after the order is placed, whereas a complex engine-machining line might take a year to be delivered after the order has been received. On average in the United States, orders lead shipments by four to five months. That is likely a common lead time for other countries as well.


